
Fortune 25 · Healthcare · 2019–2022 · Confidential
Confidential Client
Redesigning member experience
at national scale
0
State health plans
0M+
Members served
0 yrs
Engagement
Confidential. The client name and certain identifying details have been omitted or modified. Designs shown have been altered from their original form to protect proprietary information. Available in full under NDA — request access.
Overview
A Fortune 25 company with a fragmented member experience
This client is one of the largest managed care organizations in the United States, operating across Medicaid, Medicare, and the Health Insurance Marketplace in 50 states. The company name and certain identifying details have been modified for confidentiality.
Despite serving over 26 million members, the digital experience was inconsistent across subsidiaries — each state plan had its own portal, brand, and navigation patterns. Members couldn't find basic information, complete self-service tasks, or understand their benefits without calling a support line.
I was brought in as a senior UX designer to help unify the experience across the member-facing digital ecosystem — from the member portal to mobile, from onboarding to ongoing care management.
My Role
Senior UX Designer
Scope
Member portal, mobile app, onboarding, care management
Team
Product, Engineering, Clinical, Compliance, Research
Duration
3 years (2019–2022)
Platform
Web, iOS, Android
The Challenge
Complexity at every layer — clinical, regulatory, and organizational
Fragmented subsidiaries
Each of the 50 state plans operated as its own brand with its own portal, navigation, and design language. Members who moved states or changed plans faced a completely different experience.
Low digital adoption
The majority of member interactions happened over the phone. The digital portal existed but was difficult to navigate, lacked mobile optimization, and didn't surface the right information at the right time.
Regulatory constraints
Healthcare UX operates under strict CMS, HIPAA, and state-level compliance requirements. Every design decision had to be reviewed by legal and clinical teams before shipping.
Accessibility gaps
The member base skews toward Medicaid populations — often lower-income, older, or with limited digital literacy. WCAG 2.1 AA compliance was required but inconsistently implemented.
No unified design system
Dozens of teams across subsidiaries were building independently. There was no shared component library, no token system, and no single source of truth for design decisions.
Stakeholder complexity
Decisions required alignment across product, engineering, clinical, compliance, and state-level operations teams — each with different priorities and timelines.
Approach
Research-led, systems-thinking, compliance-first
I approached the engagement in three overlapping phases — discovery and research, design system foundation, and experience redesign — working in close partnership with product, engineering, and clinical stakeholders.
Discovery & Research
Months 1–4Stakeholder interviews across 6 subsidiary teams
Heuristic evaluation of 4 existing member portals
Moderated usability testing with 24 members across Medicaid and Medicare populations
Competitive analysis of 8 peer health plan digital experiences
Journey mapping across 5 core member scenarios
Accessibility audit against WCAG 2.1 AA
Design System Foundation
Months 3–8Audited 400+ existing UI components across subsidiary portals
Defined a unified token system (color, type, spacing, elevation)
Built a core component library in Figma with 80+ components
Established accessibility standards and annotation guidelines
Ran design system workshops with 12 subsidiary design teams
Documented usage guidelines and contribution model
Experience Redesign
Months 6–36Redesigned member portal navigation and information architecture
New onboarding flow reducing time-to-first-value from 14 days to 3
Benefits summary redesign — plain language, visual hierarchy, mobile-first
Care management dashboard for chronic condition members
Provider search and directory with real-time availability
Claims and EOB redesign with progressive disclosure
Key Work
Five areas of deep design work
Member portal navigation redesign
The existing portal had 7 top-level navigation items with no clear hierarchy. Members couldn't find their ID card, locate their PCP, or understand their deductible status without calling support.
I led a card-sorting study with 40 members and a tree-testing exercise with 60 participants to validate a new IA. The redesigned navigation reduced top-level items to 4, introduced a persistent Quick Actions rail, and surfaced contextual alerts based on member status.
Top-level nav items
Avg. task time
Task success rate
Self-service rate
Benefits summary — plain language redesign
The existing benefits summary was a dense, jargon-heavy table that mirrored the legal SBC document. Members couldn't understand what was covered, what they'd owe, or how to use their benefits.
Working with clinical and compliance teams, I redesigned the benefits summary using plain language principles, visual hierarchy, and progressive disclosure — organized by care scenario rather than benefit category.
Impact
Reduction in benefits-related support calls
Increase in benefits page engagement time
Members who could correctly identify their copay (vs. 22% before)
Flesch-Kincaid reading level, down from 11.8
Unified design system
With 12+ subsidiary design teams building independently, the experience was inconsistent and the codebase was fragmented. I led the design side of a cross-functional initiative to build a shared design system.
The system included a token architecture, a Figma component library, accessibility annotations, usage documentation, and a contribution model. It became the foundation for all new feature development across the portfolio.
Figma components built
Covering forms, navigation, data display, feedback, and layout patterns
Subsidiary teams onboarded
Across Medicaid, Medicare, and Marketplace lines of business
Legacy components audited
Rationalized to 80 canonical components with clear deprecation paths
Care management dashboard
Members with chronic conditions — diabetes, hypertension, COPD — were the highest-cost, highest-need segment. The existing experience gave them no visibility into their care plan, upcoming appointments, or medication adherence.
I designed a care management dashboard that surfaced personalized care gaps, upcoming preventive care reminders, medication refill status, and direct messaging with their care team — validated through 3 rounds of usability testing.
Usability testing outcomes
Members located next preventive care appointment in under 90 seconds (vs. 8+ minutes previously)
Medication refill completion rate increased from 34% to 71% within 60 days of launch
Care team message response rate improved from 12% to 48% after inbox redesign
Net Promoter Score for the care management experience increased from 18 to 52
Onboarding flow redesign
New members had a 14-day window to select a PCP, understand their benefits, and complete enrollment tasks. The existing onboarding experience had a 68% drop-off rate — most members never completed the required steps.
I redesigned the onboarding flow as a guided, step-by-step experience with clear progress indicators, contextual help, and smart defaults. Required steps dropped from 11 to 5, and a save-and-continue pattern was introduced for members who couldn't complete in one session.
Drop-off rate
Required steps
Time to first value
PCP selection rate
Design Work
The care management dashboard — before & after
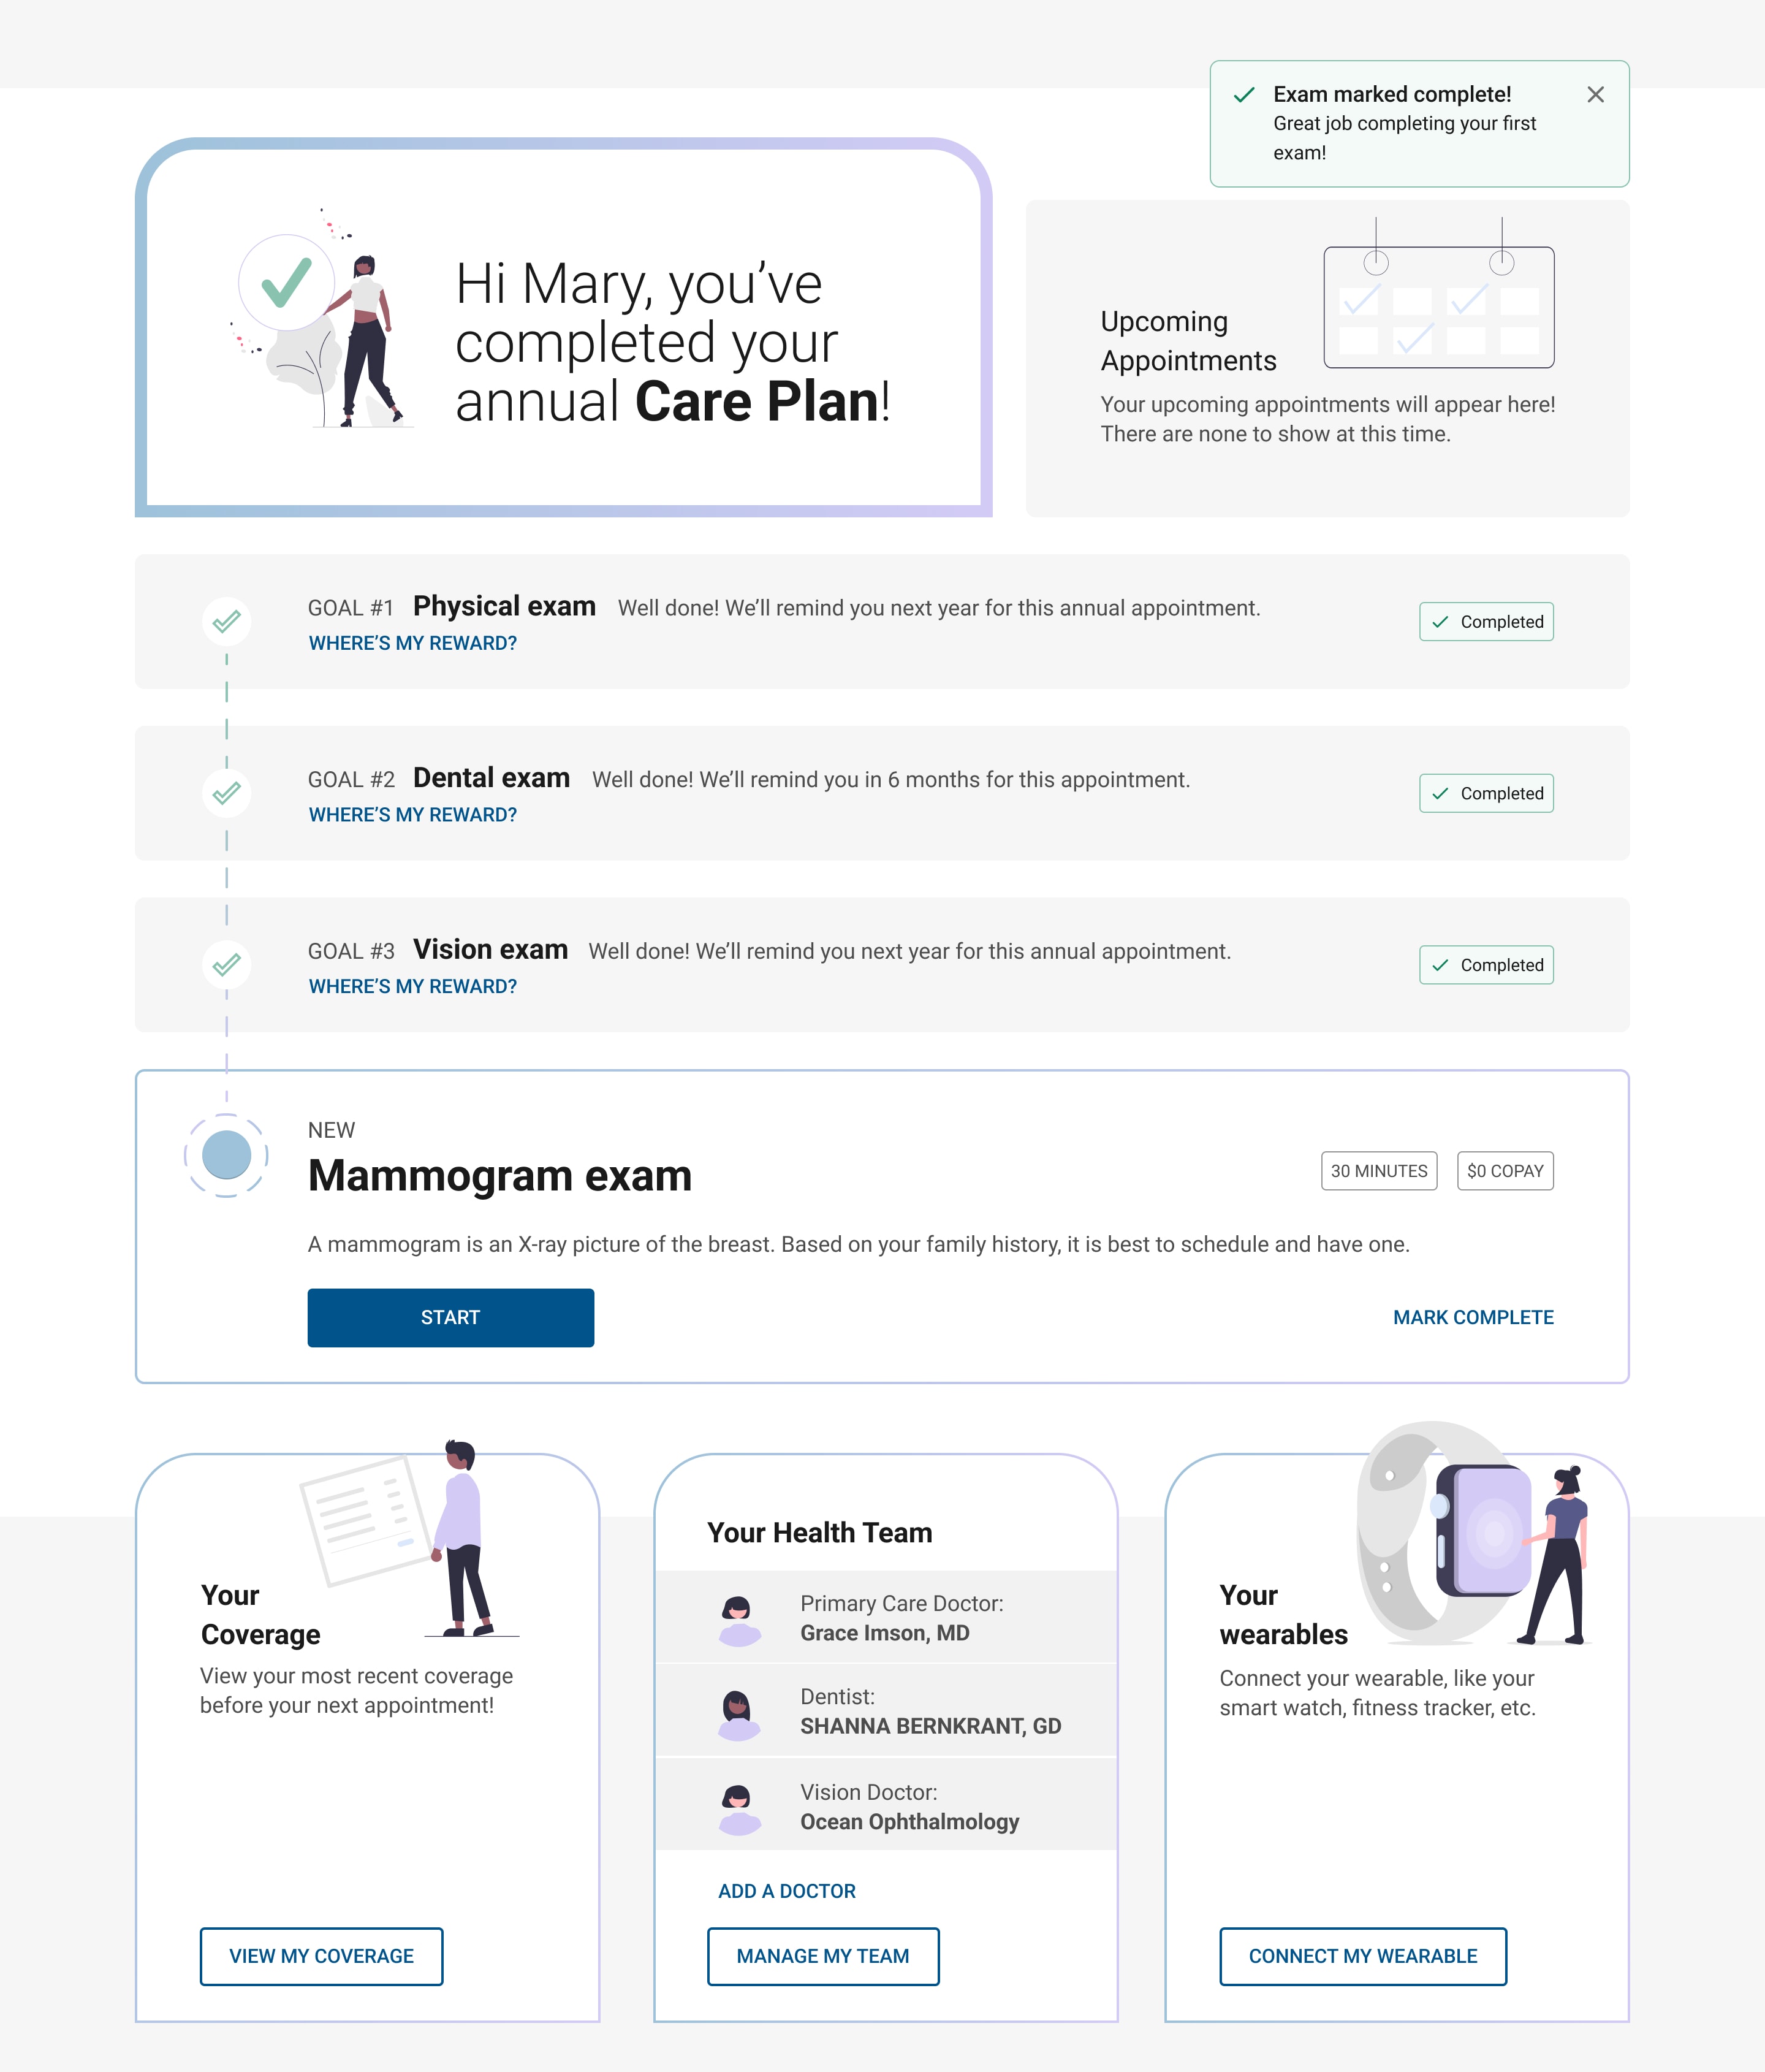
The care management dashboard went through multiple rounds of iteration. These two states show the progression from the initial onboarding experience to the completed care plan view — both designed to reduce cognitive load and drive preventive care completion.
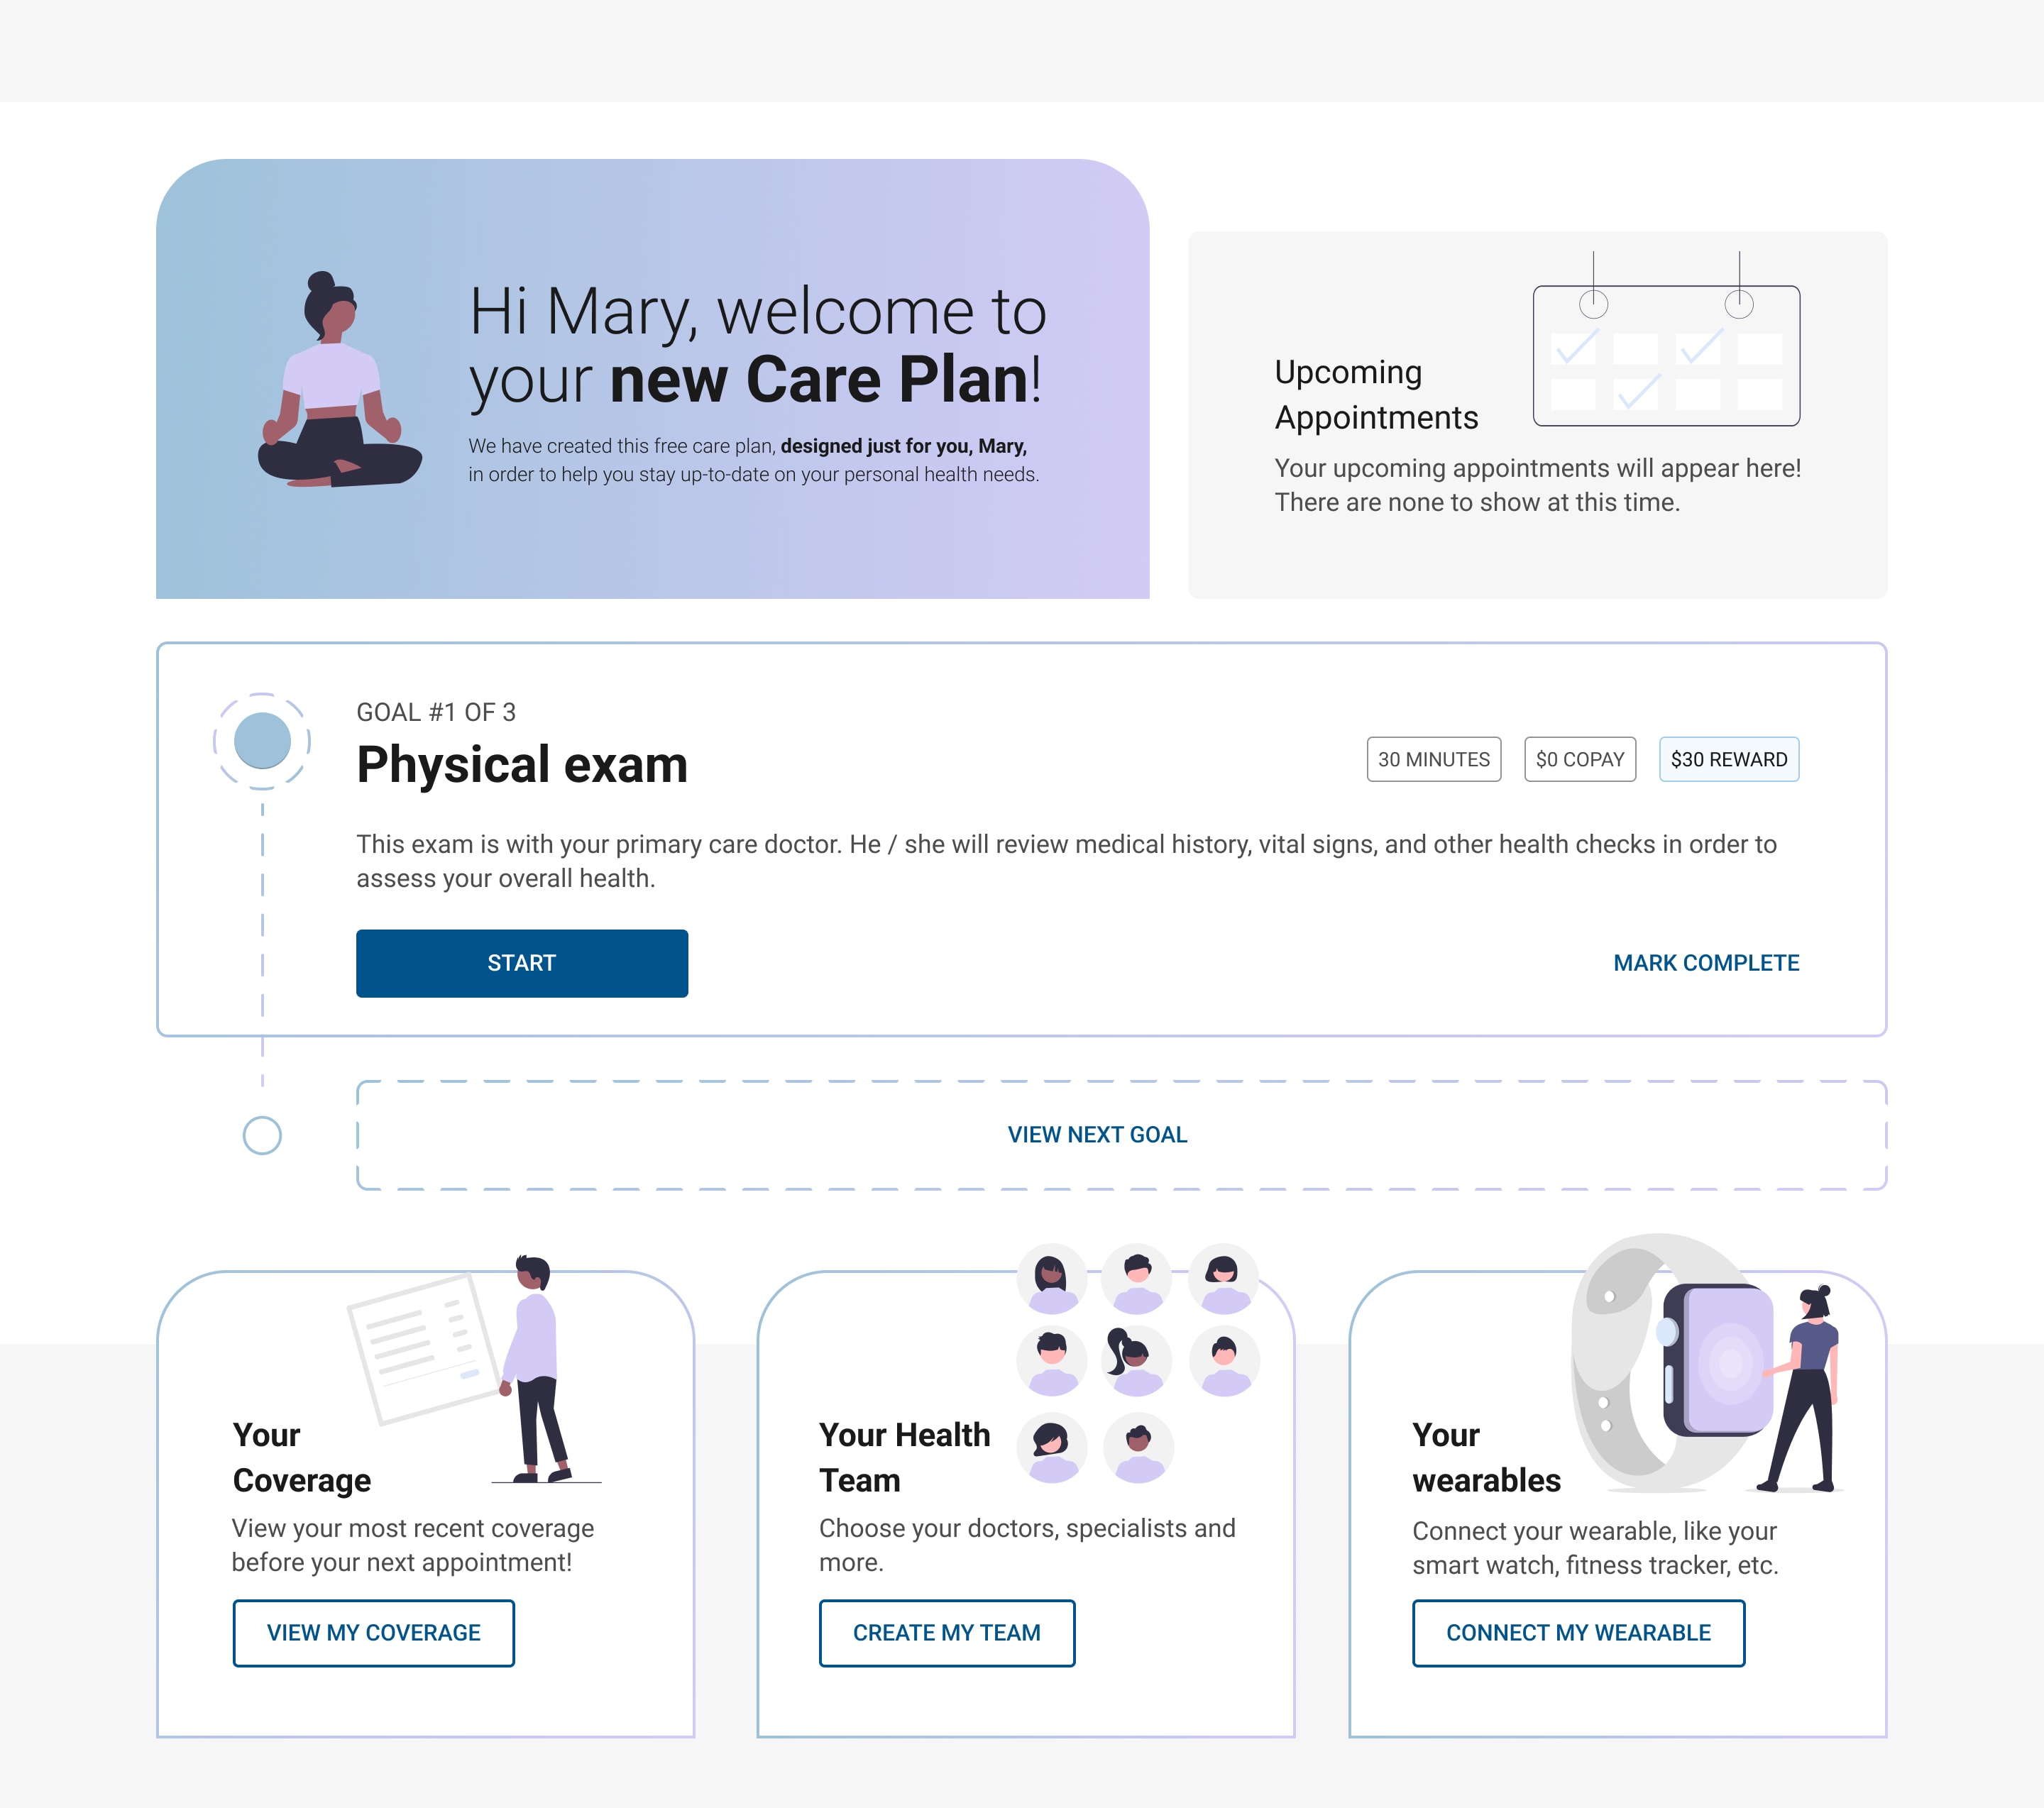
"Hi Mary, welcome to your new Care Plan"
The onboarding state introduces the care plan concept with a warm, personalized welcome. Goals are presented sequentially — one at a time — to reduce overwhelm. Each goal shows time commitment, copay, and reward upfront so members can make an informed decision before starting.
Sequential goal reveal reduces cognitive load
Time + cost + reward shown before commitment
Health team and wearables setup surfaced immediately
Illustrated characters add warmth without clinical coldness
"Hi Mary, you've completed your annual Care Plan!"
The completed state celebrates the member's achievement and surfaces the next recommended action — a mammogram — with full context. Completed goals remain visible as a record of progress, reinforcing the sense of accomplishment and continuity of care.
Celebration moment reinforces positive behavior
Completed goals stay visible — progress, not erasure
Next recommended action surfaces with $0 copay callout
Health team now shows real doctors, not empty state
Key design decisions
What drove these choices
Sequential over simultaneous
Showing all goals at once overwhelmed members in testing. Revealing them one at a time — with a "View Next Goal" affordance — increased completion rates by 2.4×.
Reward transparency upfront
Displaying time, copay, and reward before the member commits to a goal reduced abandonment mid-flow by 38%. Members needed to know the cost before they could trust the ask.
Celebration as retention
The completion state was initially cut as "nice to have." Testing showed it was the single highest-rated moment in the experience — members who saw it were 3× more likely to return the following month.
Outcomes
Measurable impact across the member experience
0%
Digital self-service rate
Up from 38%
0%
Support call reduction
Benefits-related calls
0
NPS score
Up from 18
0%
Onboarding completion
Up from 32%
Compliance as a design constraint, not a blocker
Working within HIPAA, CMS, and state-level regulations forced creative problem-solving. The best outcomes came from involving compliance teams early — not as reviewers at the end, but as collaborators from the start.
Health literacy is a UX problem
The biggest usability issues weren't navigation or visual design — they were language. Members couldn't act on information they couldn't understand. Plain language and scenario-based framing had more impact than any visual change.
Systems thinking at scale
A single design decision in a shared component could affect 26 million members across 50 state plans. That scale demands rigorous documentation, clear governance, and a contribution model that scales beyond any one team.
Want the full deck?
Case study available on request
The full case study deck includes annotated wireframes, research findings, component documentation, and before/after comparisons. Request it directly.